
The media have been quick to report on the Toronto real estate market volatility based on recent short-term comparisons. But a deeper analysis of the number shows that’s a blip, not the full story.
Outline Financial produced a more comprehensive 10-year analysis of Toronto’s “416” region housing prices using the Toronto Real Estate Board’s (TREB) data.
The discovery: a strong market that would outperform many investment portfolios.
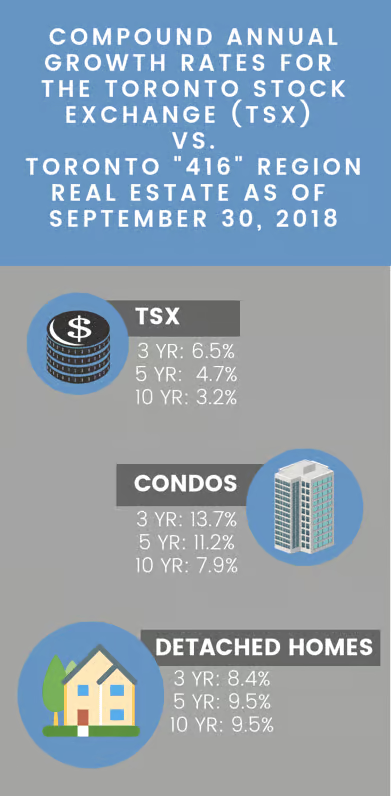
In fact, as at September 30, 2018, the TSX Composite Index had a 10-year return of 3.2%* on a compound annual growth rate (CAGR) basis compared to 9.5% CAGR for detached homes and 7.9% CAGR for condos in TREB’s “416” region over the same 10-year period. Even if you look at it over a shorter time horizon like 3 or 5 years, Toronto real estate still generated greater returns as outlined in the enclosed infographic.
Is detached back? (…or maybe it never left)
We’re coming out of turbulent market conditions (fueled primarily by the phycological market impact of the government’s Fair Housing Plan announcement in 2017) and the hardest hit property segment was the detached housing market. This is in line with the trend: in times of uncertainty, condos and more affordable housing outperform as decisions to upsize to a detached (or upgrade to a new detached) are postponed until the market stabilizes.
The analysis, however, clearly points to a detached housing market on the upswing during a period in Toronto where there is relatively low inventory. In September 2018, the “416” region had only 1.9 months of inventory across all property types. That means if there was no new supply added to the resale housing market, all the listed properties would be gone in less than 2 months given the current pace of sales.
The numbers in Outline’s report demonstrate the price and sales bubble in early 2017, the bursting of that bubble, and the ensuing correction that has resulted in more stable growth which is providing buyer with renewed confidence in the detached market. Even with the market correction, as illustrated in the infographic, the returns on housing over the mid and long term is substantial.
Now may be a great time to move up
Condos have performed exceptionally well over the past 5 years narrowing the price gap between the average condo and average detached home in the “416” region. In early 2017, a buyer paid on average 206% more to live in a detached vs. condo and now it’s only 118% more. This works out to paying about $726,000 more rather than the previous $1,060,000 more paid at the peak.
These dynamics set the stage for an excellent move-up opportunity.
Have Questions?
To request a copy of the full report, or to discuss how the above can help your purchase or sale strategy, please contact Union Realty Team |rochelle@unionrealty.ca| (416) 686-9618.
Guest Writer: Outline Financial is one of Canada’s top mortgage teams offering direct access to rate and product options from over 20 banks, credit unions, and mono-line lenders all in one convenient service. The Outline team was formed by senior level bankers and financial planners that wanted to offer their clients strategy and choice with an exceptional service experience. www.outline.ca/hello@outline.ca/ 416-536-9559 / 855-444-5121
*TSX Composite Index Price on the Last Day of Trading for September (Historical Prices) – Tuesday September 30th, 2008 = $11,752.90; Monday September 30th, 2013 = $12,787.19; Wednesday September 30th, 2015 = $13,306.96; Friday September 28th, 2018 = $16,073.14.
**Comparison Note: the growth rates quoted in the info graphic do not account for any tax implications (i.e., capital gains, or principal residence tax exemption, etc.) or other expenses (i.e., fees, commissions, closing costs, etc.). Historical results are not necessarily an indication of future performance.

Buying, Selling, or Have Questions?
We can help. Connect with our East End experts today!